5 PanGaea
PanGaea: A Unified Memory-Efficient Accelerator for Pangenome Chaining and Alignment
Abstract
Pangenome graphs have emerged as a promising genome representation that combine many genomes into a graph, showing all possible genetic variants in a population. However, mapping DNA sequences to pangenome graphs involves multiple computation stages, from graph indexing to read alignment. Despite significant efforts, current frameworks optimize individual stages in isolation but overlook memory bottlenecks across the entire pipeline of sequence-to-graph mapping, where the intermediate data exchanged between stages contributes up to of total DRAM access.
To this end, we posit that the sequence-to-graph pipeline should be optimized as a whole, rather than in isolation, to effectively exploit intermediate data reuse across stages. We propose PanGaea, a novel accelerator that fuses the heterogeneous computing kernels of the sequence-to-graph pipeline, thereby reducing intermediate data exchange between memory-intensive stages and optimizing DRAM access. Specifically, we formulate a memory model for linear chaining, graph chaining, and wavefront alignment, and repurpose graph traversal techniques to partition pangenome graph with improved data locality and parallelism. In addition, we design a new accelerator architecture and dataflow mapping that dynamically support the diverse computation patterns of different sequence-to-graph stages. Compared to state-of-the-art ASIC designs, PanGaea delivers on average higher throughput , better energy efficiency and higher area efficiency .
1 Introduction
Precision medicine and population genomics have created a strong need for efficient genome analysis systems. Moving from linear reference genomes to pangenome graphs marks a major shift in computational genomics, as these graphs can represent genetic variation from many individuals within a single structure [1]. By modeling genetic differences as alternative paths in the graph, pangenome references reduce reference bias and support variation-aware read mapping in one unified process [2]. Large efforts such as the Human Pangenome Reference Consortium (HPRC) now provide high-quality pangenome graphs built from more than 90 diverse haplotypes and covering billions of base pairs [3]. However, the improved biological accuracy brings significant computational challenges. Current sequence-to-graph (S2G) mapping tools face serious performance limits, with state-of-the-art software processing long-read datasets at speeds far below the output of modern sequencing machines [4].
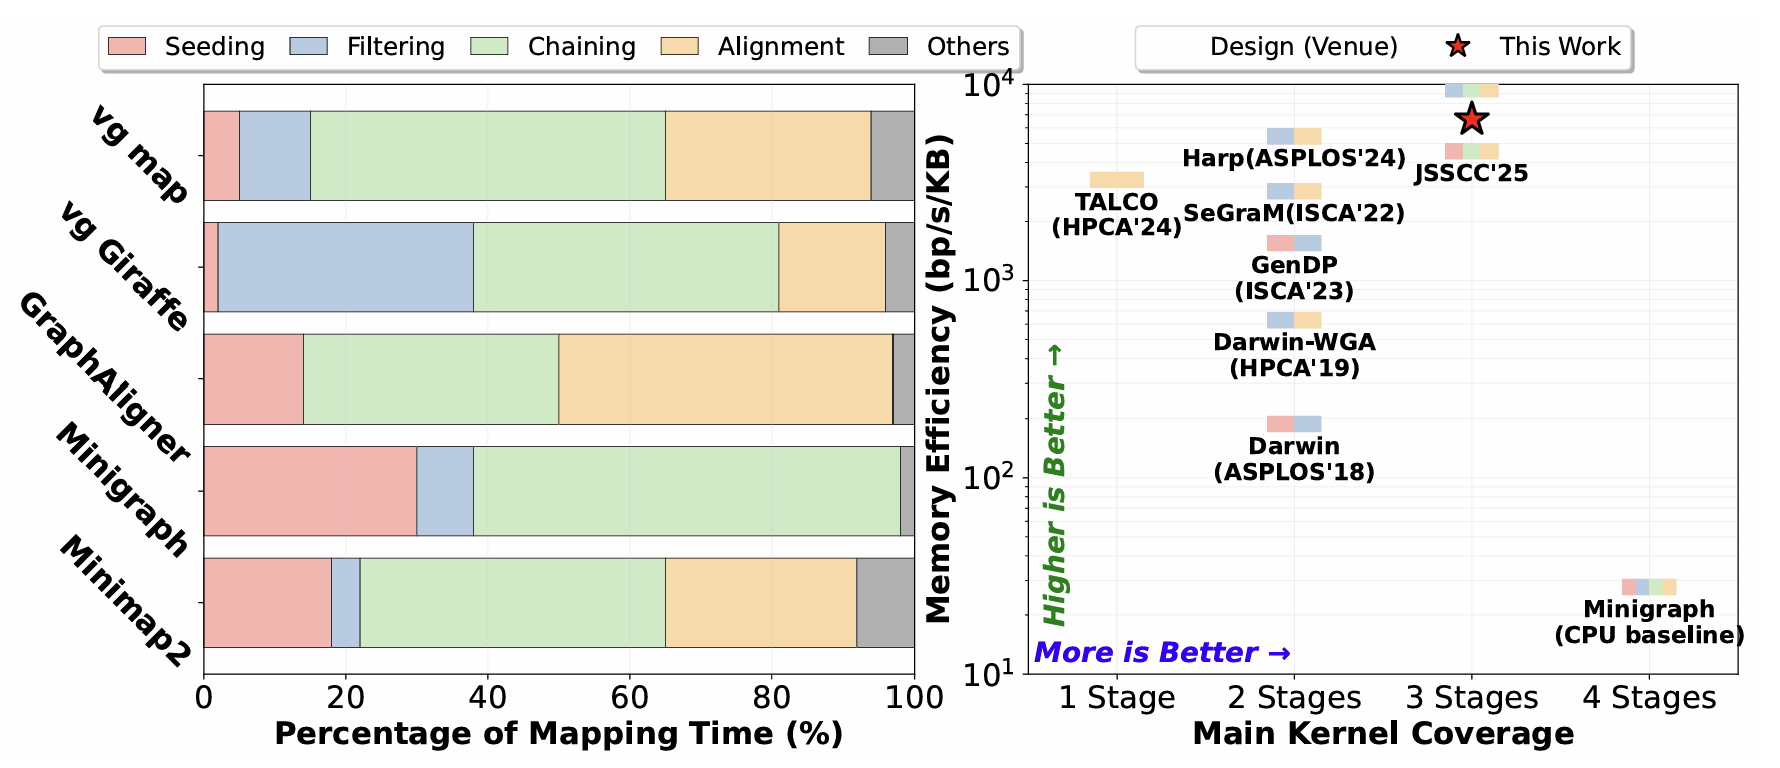
Figure 1: (a) Execution time breakdown of all computation kernels in S2G mapping applications; (b) Memory efficiency comparison of state-of-the-art accelerators
Prior acceleration efforts have primarily focused on optimizing individual computational kernels. For example, GenDP [5] introduces reconfigurable compute units and a novel partitioning algorithm to support diverse dynamic programming (DP) kernels used in alignment and chaining. TALCO [6] develops a new tiling strategy that efficiently computes and stores DP scores for alignment. Harp [7] leverages the quasi-sequential structure of genome graphs and employs a compact on-chip data structure to accelerate chaining and filtering. Segram [8] presents the first minimizer-based seeding accelerator coupled with bitvector-based alignment. In general, optimizations for sequence alignment mainly focus on wavefront algorithms with dense DP computation patterns [9], whereas sparse dependency structure of seeding is the primary optimization objective in chaining stage [4]. However, our workload characterization shows a critical limitation of this kernel-centric approach: no single computational stage dominates across different implementations as illustrated in Figure 1(a).
Moreover, we observe that independently optimizing each stage of sequence-to-graph mapping introduces substantial intermediate data movement, which becomes the primary source of DRAM traffic. This is because intermediate data, such as seed anchors, chaining metadata, and wavefront DP matrices, are repeatedly fetched from off-chip memory across different stages. While prior work partially addresses the memory bottleneck for different stages of sequence-to-graph mapping, as shown in Figure 1(b), very few studies have explored cross-stage data reuse opportunities. To address this limitation, we propose PanGaea, a unified and memory-efficient accelerator for sequence-to-graph mapping that integrates heterogeneous kernels through novel tiling strategies and a co-designed hardware architecture. By unifying these computing stages, PanGaea retains intermediate data on-chip until the entire pipeline completes, thereby eliminating unnecessary DRAM accesses. The major contributions of this paper are:
Workload Characterization of Sequence-to-Graph Applications: We conduct a comprehensive characterization of the memory behavior and runtime profiles of modern sequence-to-graph applications. Our analysis reveals a key insight that intermediate data reuse plays a critical role in guiding accelerator design for genome graph workloads.
Graph Tiling and Analytical Modeling for Fusing S2G Analysis Pipeline: We introduce an analytical model that mathematically formulates tiling decisions across heterogeneous computing kernels to minimize DRAM access in sequence-to-graph mapping. Furthermore, we repurpose graph traversal techniques to efficiently partition pangenome graphs, enhancing both parallelism and data locality.
A Unified Accelerator Design: We propose a unified accelerator architecture capable of supporting both sparse chaining operations and dense wavefront alignment. The architecture provides various computation modes and supports different communication patterns that facilitate intermediate data reuse across computing units.
2 Background and Motivation
2.1 Genome Graph Representation
Conventional genome analysis maps query reads to a single linear reference genome, which cannot represent population-level variation and leads to reference bias [10]. Genome graphs overcome this limitation by embedding variants directly in the data structure: vertices store sequence fragments, and edges encode valid adjacency [11]. Unlike linear representations that require separate alignments to detect insertions, deletions, and substitutions, genome graphs express these differences as alternative paths through shared vertices, which provide a unified yet variation-aware mapping. Given that human genomes share sequence identity [12], genome graphs are mostly linear and punctuated only by short variant bubbles (i.e., branches) [10]. Typically, the bubbles only span tens of base pairs and only exist in few alternative paths.
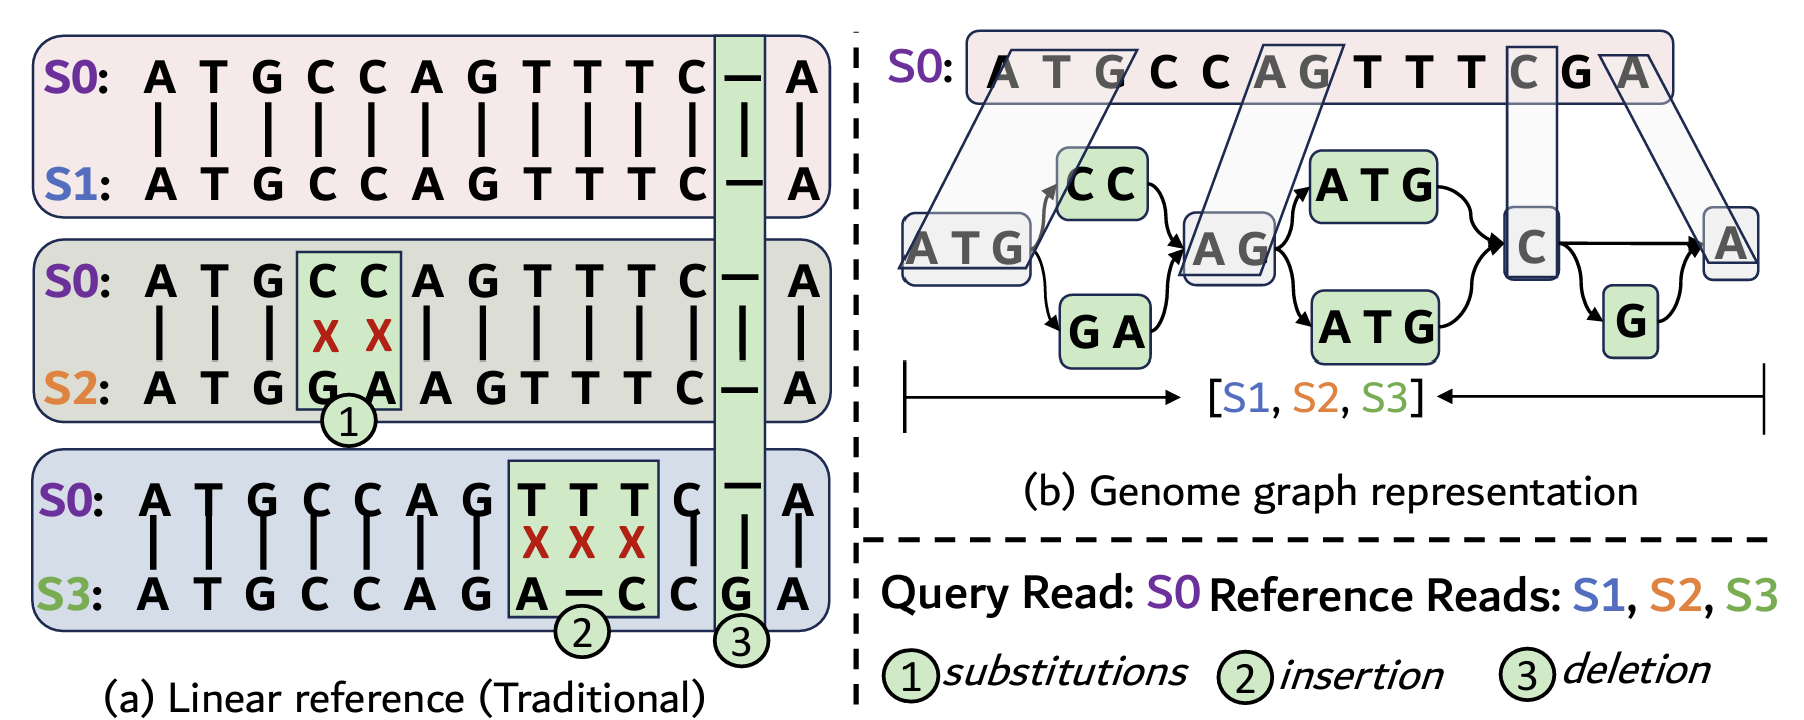 Figure 2: An illustrative example showing: genome linear sequence representation vs. pangenome graph representation
2.2 Sequence-to-Graph Mapping Computation
Sequence-to-graph mapping involves multiple computing stages to identify candidate alignment locations from millions of potential matches to a final optimal path. As shown in Figure 3, the overall process follows the standard seed-and-extend strategy [10, 13]: (I) Indexing preprocesses the pangenome graph offline to construct a hash-based index [8, 14] that maps fixed-length subsequences to their occurrences across graph vertices, enabling fast exact-match lookups. (II) Seeding splits the input read into overlapping minimizers (typically 15-25 bp) and queries the index; each hit produces a seed, yielding thousands to millions of candidates depending on read length [15]. (III) Linear chaining groups seeds within the same vertex using sparse dynamic programming, scoring candidate pairs based on diagonal consistency and gap penalties [16]. (IV) Graph chaining then links these linear chains across vertices by computing shortest paths between chain endpoints to validate reachability through variant bubbles, where graph traversal often dominates runtime in complex regions [14]. (V) Filtering removes spurious seeds from repetitive regions using frequency thresholds and spatial coherence checks. Finally, (VI) Alignment executes base-level sequence alignment between the read and the selected graph path using wavefront alignment (WFA) [17]. Each stage of sequence-to-graph mapping poses different demands on the underlying hardware. For example, indexing and seeding require large, irregular hash-table accesses; chaining performs sparse dynamic programming with limited reuse; and WFA alignment yields dense DP computation with predictable locality. Such heterogeneous workload characteristics restrict cross-stage optimization.
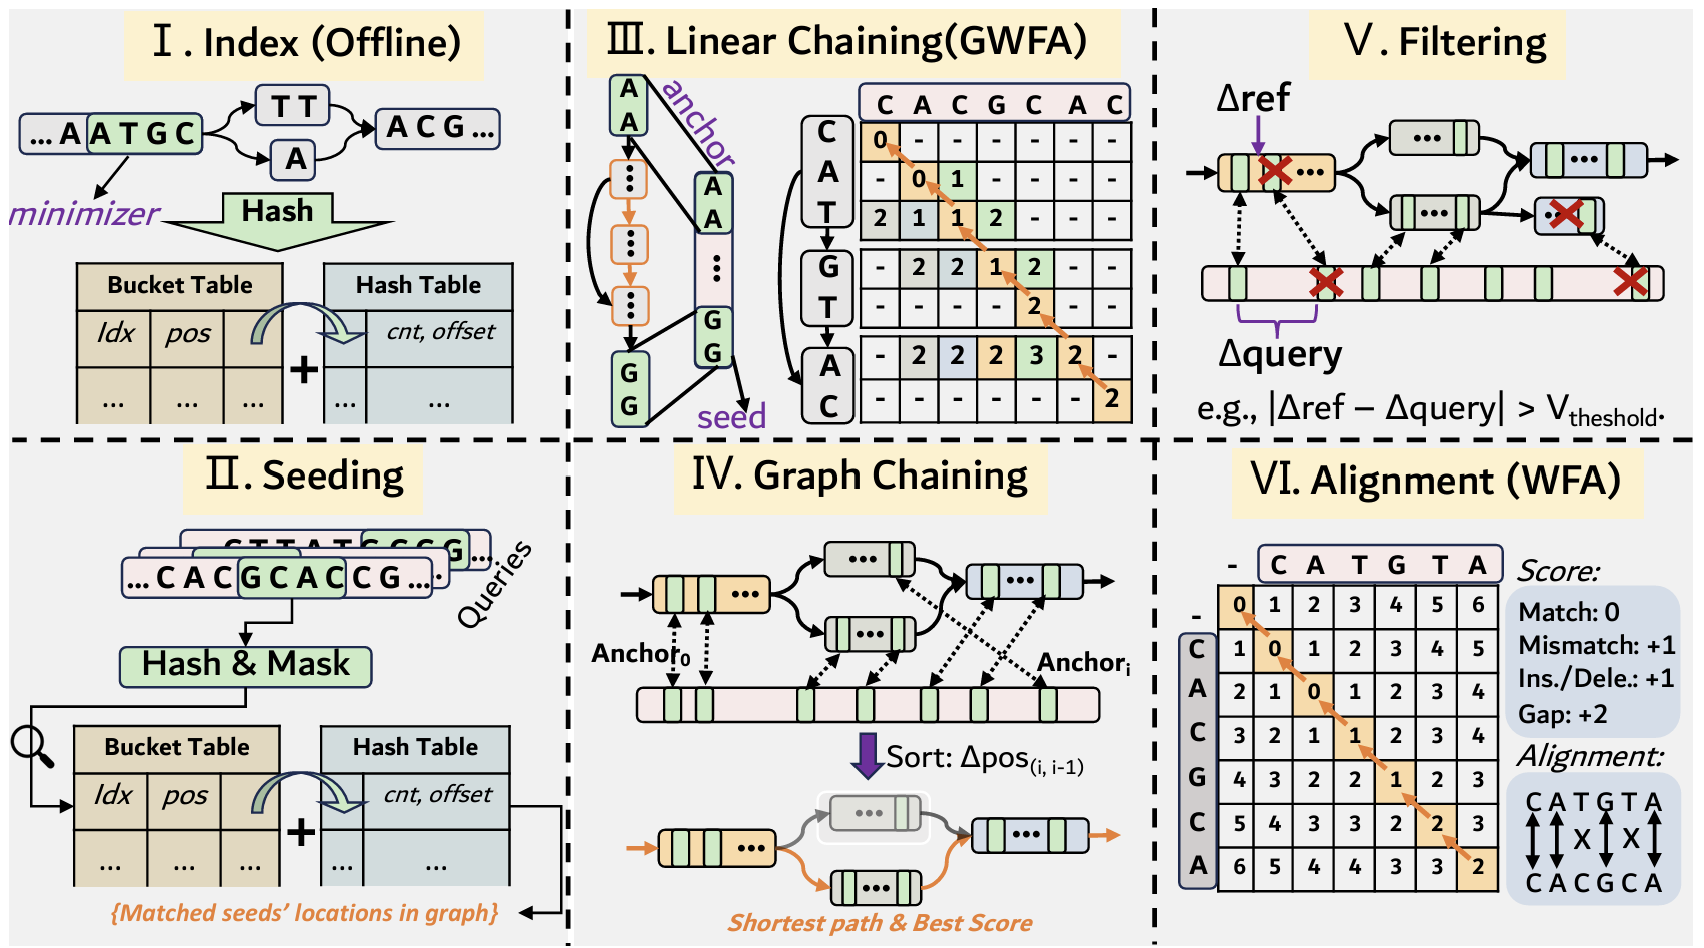 Figure 3: Sequence-to-Graph Mapping Flow
2.3 Motivation
To understand workload characteristics of sequence-to-graph mapping, we profiled five representative CPU-based tools (Minimap2 [13], Minigraph [14], GraphAligner [18], vg Giraffe [19], vg map [10]) on human chromosome datasets. Figure 1(a) shows execution time breakdown across pipeline stages. Our critical observation is: no single stage dominates across all implementations. Minigraph spends of its runtime in chaining and does not perform alignment, whereas GraphAligner exhibits a more balanced distribution between chaining and alignment . In contrast, vg Giraffe is dominated by filtering and chaining . This runtime variation indicates that accelerating any single stage yields limited system-wide benefit across tools. For example, alignment optimizations would benefit GraphAligner but not Minigraph, while improving chaining yields inconsistent gains across different mappers.
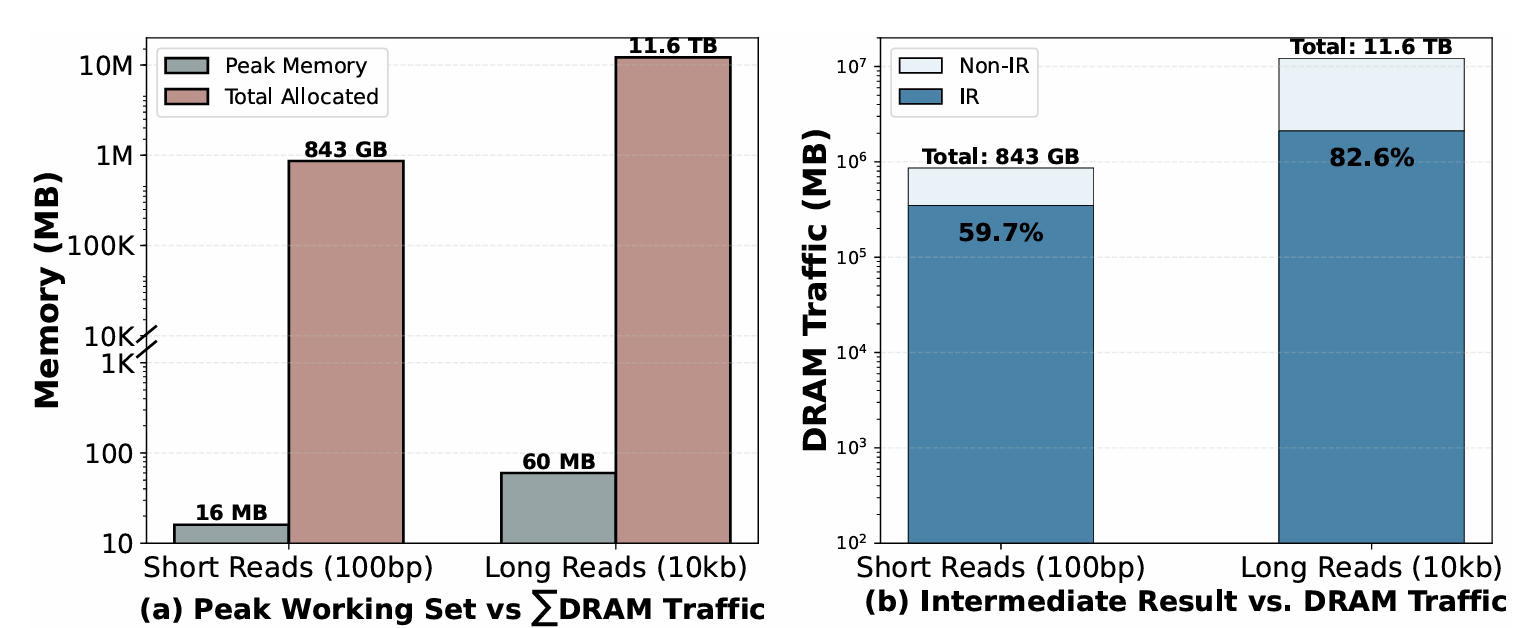 Figure 4: Memory allocation breakdown and peak vs. total DRAM traffic comparison.
In addition, our workload characterization shows the root cause of sequence-to-graph mapping applications, where intermediate data movement dominates total DRAM traffic across all frameworks. We use Minigraph to profile all memory allocations and data transfers while mapping 10,105 long-read queries (10 Kbp, error rate) and 92,651 short-read queries (100 bp, error rate) from human chromosome 1 to the GRCh38 genome graph [20]. As shown in Figure 4(b), each query incurs an average of 1205 MB of cumulative memory footprint, with the majority attributed to intermediate results (i.e., the data reused by consecutive stages), which occupy of total DRAM traffic in short reads and in the case of long reads.
3 Memory Optimization for Sequence-to-graph Mapping
While loop fusion is widely used to improve data locality in many machine learning workloads, applying fusion to sequence-to-graph mapping introduces unique challenges: (1) heterogeneous computing kernels with fundamentally different workload characteristics, and (2) complex computation dependencies arising from graph irregularity. In this section, we present a mathematical formulation of DRAM access in sequence-to-graph mapping to guide the selection of tiling factors that minimize overall memory traffic. We further propose a graph-partitioning technique to efficiently traverse pangenome graphs to improve parallelism and data locality.
3.1 Off-Chip Memory Access Formulation
We analytically model the DRAM access of both the baseline and fused execution pipelines to quantify data reuse achieved through loop fusion. Throughout this analysis, we assume the data precision and size based on our memory profiling but can be changed to any values. In our model, each anchor uses bytes (encoding query and graph coordinates, strand, and span length); each linear chain requires bytes (storing boundary positions, scores, and anchor offsets); each graph chain consumes KB (including vertex sequences, path descriptors, and alignment scores); and each WFA buffer occupies KB to maintain the diagonal arrays for match, insertion, and deletion states under typical inter-anchor gap lengths. These sizes reflect standard allocation patterns across state-of-the-art sequence-to-graph mapping frameworks.
Analytical Model for Baseline. In conventional stage-by-stage execution, each pipeline stage processes the complete dataset independently, reading input from DRAM and writing output back to DRAM. For a query that generates seed anchors, the per-stage DRAM access is:
where and are the number of linear and graph chains produced (typically and for realistic sequences). The total baseline DRAM traffic is:
The dominant term is alignment, where each inter-anchor gap independently allocates and frees a WFA buffer, creating allocation churn. Our profiling (Section 2) shows this yields 1,205MB per query for 10Kbp reads, with from alignment stage buffer cycling.
Analytical Model for Kernel Fusion. Building on traditional tiling, we divide the anchors into tiles, where each tile processes anchors through all fused stages before producing output. The key distinction is that intermediate data, such as linear chains, graph chains, and WFA buffers, remain resident in the global buffer (GLB) and are reused across stages within the same tile. The resulting DRAM access of kernel fusion is:
where is the average graph chains per tile and bytes per alignment. Especially, intermediate data chunks and and WFA buffers are eliminated from DRAM traffic, as they are produced and consumed entirely within GLB. WFA buffers are further optimized by sharing a fixed pool across all gaps within a tile, replacing per-gap allocation with persistent buffer reuse.
Tiling Optimization. The optimization problem seeks the tiling factor that minimizes DRAM traffic while satisfying GLB capacity, , constraints:
3.2 Tiling Strategy of S2G Mapping
The DRAM-access formulation indicates that, due to the limited on-chip buffer, only a portion of the pangenome sequence can reside on chip. However, tiling graph chaining introduces new challenges. This is because: (1) Pangenome graphs exhibit extreme sparsity with predominantly linear topology [21]; (2) Vertices in graphs contain variable-length DNA sequences [22]; (3) pangenome graphs introduce long-range dependencies due to distant connections [23].
We therefore formulate the problem as a partitioning task to balance sequence length while minimizing path cuts. Classical graph partitioning algorithms such as METIS [24] aim to reduce inter-partition communication, but they either face scalability issues on large pangenome graphs or fail to consider node-level sequence-length heterogeneity. To address these limitations, we adopt a breadth-first search (BFS) with a modified bin-packing scheme to tile the graph during the graph chaining stage, thereby reducing cross-partition communication while respecting on-chip buffer constraints.
Formally, consider a pangenome graph , where denotes the DNA string length associated with node . We first apply BFS to group spatially adjacent vertices, which helps avoid long-range dependencies. Because pangenome graphs exhibit predominantly linear topology, BFS expands with limited width, effectively eliminating most long-distance interactions. Given an on-chip buffer capacity that allows each partition (i.e., "bin") to accommodate at most bases, we assign nodes to a bin such that . During traversal, nodes satisfying this length constraint are greedily packed into the current bin. Moreover, BFS can start from multiple seed vertices in parallel, enabling concurrent construction of independent partitions.
4 PanGaea Accelerator
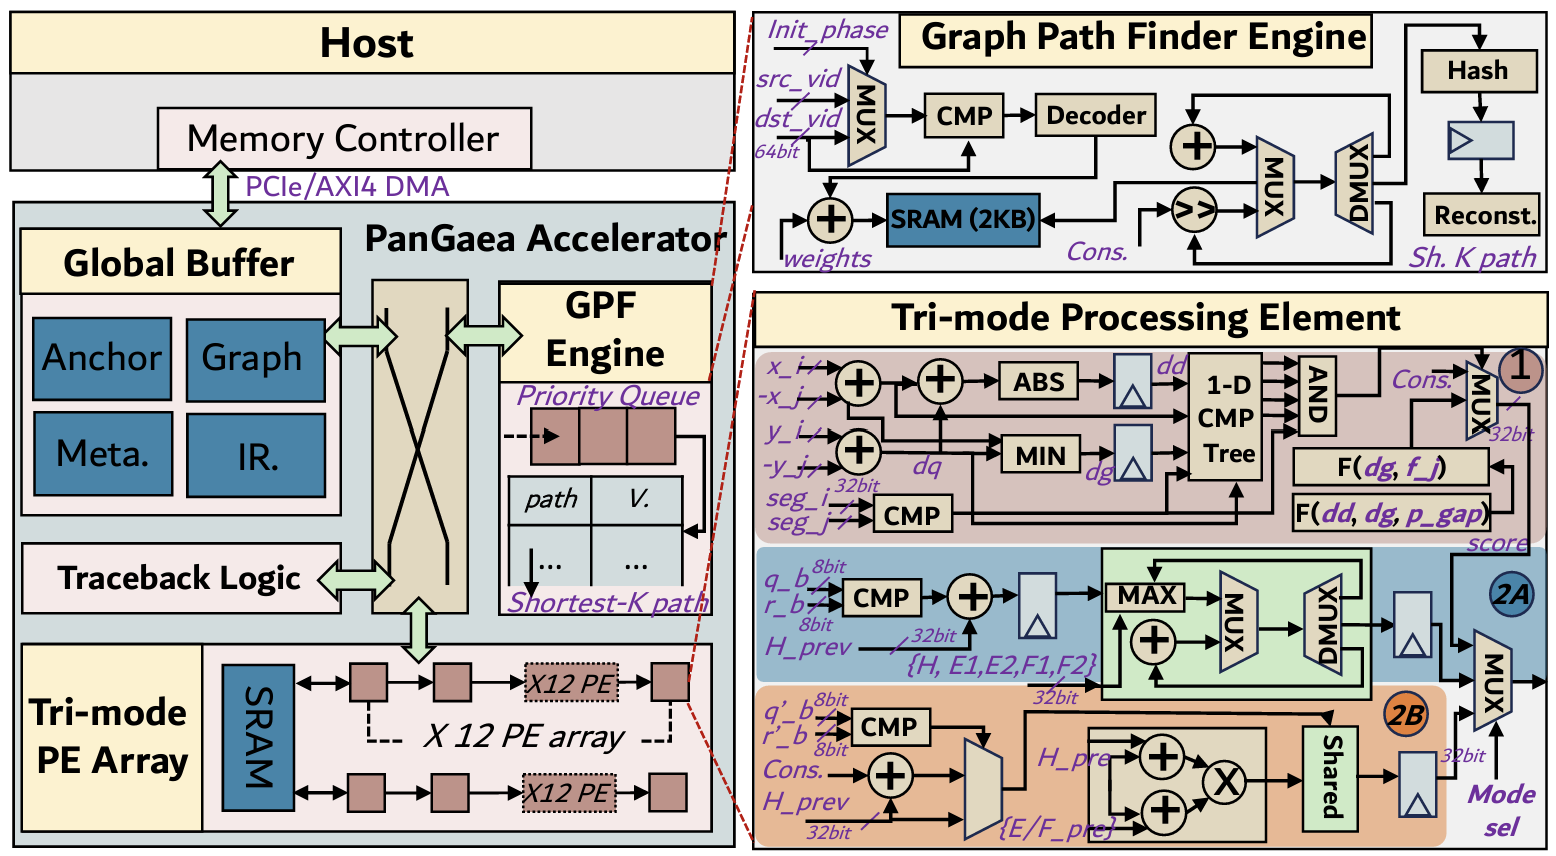
In addition to tiling and graph partitioning, current accelerators are unable to accommodate different computing kernels of sequence-to-graph mapping. To address this issue, we propose PanGaea accelerator design that can support several fundamental operations such as sparse dynamic programming, shortest-path search, and dense wavefront DP. Figure 5 shows the overall accelerator design.
4.1 Overall Architecture
Global Buffer Organization. The global buffer (GLB) stores all data required for sequence-to-graph mapping. We partition the GLB into four logical banks to eliminate structural hazards during concurrent stage execution: the Anchor Bank stores seed anchors for the current tile, the Graph Topology Bank caches graph vertex sequences and adjacency lists for path finding, the Metadata Bank buffers linear and graph chaining metadata (boundary positions, scores, anchor offsets), and the IR (Intermediate Result) Bank maintains intermediate computation results, including partial chaining scores and traceback pointers. This design enables pipeline-level parallelism across tiles; while the PE array processes Tile , the control unit prefetches anchors for Tile into the Anchor Bank without conflicts. Each bank employs multi-ported SRAM (two read ports and one write port) to support simultaneous PE-array accesses and background transfers.
Additionally, a local scratchpad SRAM directly connects to the PE array to store wavefront DP matrices. This scratchpad provides low-latency access for the temporal indexing required by WFA, where computing penalty level requires reading from the results from multiple previous iterations. By placing DP matrices in the local scratchpad rather than the GLB, we reduce access latency from 3 cycles (GLB read through NoC) to 1 cycle (scratchpad read), critical for sustaining PE array throughput during alignment.
Graph Path Finder (GPF) Engine. The GPF engine accelerates the graph chaining stage by computing shortest paths between linear-chain endpoints across graph vertices. It implements Dijkstra's shortest- algorithm [25] using a priority-queue-based approach [26], as illustrated in the GPF microarchitecture of Figure 5. For each graph chain, the engine explores candidate paths from source to destination vertices, pruning branches that exceed predefined distance thresholds to constrain search complexity. The distance table (a 16 KB SRAM) in the records visited vertices and their optimal costs, thereby avoiding redundant traversal of graph bubbles.
Flexible PE Array. The PE array in PanGaea is organized as a grid of processing elements, each operating in three distinct modes that correspond to the fused pipeline stages. Every PE integrates a set of shared arithmetic units (e.g., adders, comparators, multiplexers) that are dynamically reassigned across modes, while mode-specific datapaths are power-gated when inactive to reduce energy consumption. Figure 5 illustrates the PE microarchitecture and shows the configurations for each operating mode:
Mode  . Linear chaining computes the chaining score between seed-anchor pairs using gap-penalized dynamic programming. The penalty score is given by:
where and denote graph coordinates (anchor positions in graph vertices), and are anchor positions in query sequence, , , and , are penalty coefficients. Each PE receives inputs , where seg encodes the graph segment associated with each anchor. The PE datapath implements the recurrence through: (1) two 32-bit subtractors computing and ; (2) an absolute-value unit and a min unit for evaluating penalty terms; (3) a 256-entry lookup table (2 KB) stored in the scratchpad for evaluations; (4) two fixed-point multipliers for scaling by and ; and (5) constraint filters enforcing linearity and bandwidth using comparators. The resulting score is propagated across the PE mesh to determine the optimal among all 144 PEs in parallel, as described in Section 4.2.
Mode  : WFA-Affine executes the wavefront alignment algorithm [17] using a two-tier affine gap model, in which anchor gaps incur different penalties depending on their length: tier 1 applies to short gaps (open cost , extend cost ), while tier 2 applies to long gaps (open cost , extend cost ). The computation is:
where indexes penalty-score levels, indexes diagonals, if query base equals reference base and 0 otherwise, and subscripts denote temporal offsets to prior wavefronts. PE inputs are for query and reference bases (2-bit nucleotide encoding in 8-bit containers), and five DP matrix values are fetched from the local scratchpad at the referenced offsets. The datapath implements: (1) an 8-bit comparator for match detection; (2) four parallel max units computing the and gap transitions; (3) two increments applying the shift in the -coordinate for the matrices; and (4) a five-way max tree selecting the optimal state. Computing these wavefront updates requires 9 scratchpad reads per PE per cycle to fetch DP matrix values from multiple penalty levels (e.g., ): the H matrix (match states) is read from 5 different prior penalty levels, while E matrices (insertion gaps) and F matrices (deletion gaps) are each read from 2 prior levels, necessitating multi-ported local memory.
Mode  : WFA-Edit computes edit-distance alignment (uniform cost per operation) for graph WFA across variant bubbles. The score updates are given by:
where mismatch if the bases match and otherwise. Each PE receives inputs and requires only three DP matrices ( less storage than Mode 2A) and three scratchpad reads per cycle, all from wavefront level . Moreover, Mode 2A and Mode 2B share arithmetic units: the match detector, adders, and MAX-tree logic (highlighted in light green in Figure 5) are reused, with mode multiplexers selecting either affine-penalty parameters or uniform constants. This sharing reduces PE area by compared to a duplication.
Traceback Logic. After alignment completes, this unit reconstructs the CIGAR string by backtracking through the DP matrices stored in the Wavefront Bank. It uses a simple FSM that reads matrix pointers (indicating whether the optimal path took a match, insertion, or deletion at each cell) and emits compressed CIGAR operations. Because traceback is sequential and accounts for negligible runtime, we provision a single lightweight engine that processes one alignment at a time and writes the resulting CIGAR string to a 4 KB region in the GLB before DMA transfer to host memory.
4.2 Proposed Mapping and Dataflow
After the workload partitioning, we propose a mapping and dataflow that can efficiently support various sequence-to-graph mapping computing kernels.
Mode 1 (Chaining) Linear chaining evaluates scores for all pairs where anchor is fixed and ranges over potential predecessors. When accelerating linear chaining in parallel, each PE independently evaluates one pair of anchor . In such a case, we use a broadcast-unicast-reduction dataflow. Specifically, as shown Figure 6 (a), anchor data is broadcast to all PEs via a shared bus (H-tree distribution [27]), while each PE receives broadcasted anchor via point-to-point connections from the . All PEs compute scores simultaneously as shown in Figure 6 (b), then through the PE mesh topology, we propagate the scores to one PE via a vertical-horizontal sequence [28] to calculate (max score, best ) to the one PE. Through vertical communication, the best score of each column is sent to the first row, and then after horizontal communication, receives the best score and stores it in the SRAM. This dataflow mapping eliminates dedicated engines for the reduction tree, reducing hardware complexity and bus delay. The reduction tree is not a separate dedicated engine as in prior works [6, 29]; instead, we embed lightweight MAX comparator stages within the PE output mixing logic, saving area compared to standalone tree implementations while reducing routing latency by 3 cycles.
Mode 2A/2B (GWFA/WFA) Wavefront alignment exhibits dependencies along diagonals in DP matrices: computing cell requires values from the diagonal PE where specifies the penalty offset. Since consecutive diagonals share significant overlap (e.g., cells and both need ), we organize PEs in a 2D mesh where neighbors exchange partial results with a bidirectional horizontal communication manner. Specifically, each PE sends matrices to its right neighbor and matrices to its left neighbor. Figure 6 (c) shows that data is sent to from by All-reduce communication.
 Figure 6: (a) Dataflow in Mode 1 with All-reduced communication; (b) PE Array; (c) Dataflow in Mode 2A and Mode 2B with All-reduced communication
5 Evaluation
5.1 Experimental Setup
Simulation. We developed a cycle-accurate simulator for PanGaea that models the unified tri-mode PE array, hierarchical memory system, and control logic. The simulator integrates with Ramulator [30] for accurate DRAM timing (DDR4-3200) and global buffer modeling (SRAM with 1-cycle latency). We synthesized the RTL design using Synopsys Design Compiler with SAED 28nm technology library under the worst PVI scenario. Post-synthesis timing analysis confirmed operation at . Power consumption was estimated using Synopsys PrimePower with switching activity annotation from representative workloads, accounting for both dynamic and leakage power. Area results include logic and memory are extracted from placed-and-routed designs with IC CompilerII [31].
Datasets. To ensure rigorous and reproducible evaluation, we follow prior research work [7] to generate synthetic query sequences using human autosomes (i.e., chromosomes 1-22) from the GRCh38 human reference assembly [32]. We created 6 distinct read datasets with stratified read counts reflecting real-world sequencing scales: 100,000 reads for short reads and 10,000 reads for long reads. For short reads, we employed ART [33] to generate 100 bp and 250 bp length reads using the HiSeq2500 dataset [34] with error rate. For long reads, we used both PBSIM3 [35] and PBSIM2 [36] on PacBio/ONT datasets [37] to simulate 10 Kbp reads across four error regimes: (PacBio HiFi model), (ONT high-quality model), (legacy PacBio CLR model), and (legacy high-error ONT model). Both simulators provided ground truth alignments in MAF format for precise accuracy validation. For the reference pangenome graph, we utilized the GRCh38 graph (v1.1) [1, 38] from the Human Pangenome Reference Consortium (HPRC), which incorporates 94 diverse haplotypes spanning 3.1 billion base pairs.
Baselines. We evaluate our approach against state-of-the-art implementations spanning diverse computing platforms: CPU-based tools (GraphAligner[18], Minigraph [39], a GPU-based tool (HGA[40]), and other ASIC designs (Darwin[41], and SeGraM[8], JSsCC'25[29]).
5.2 Performance Analysis
Figure 7 compares throughput across representative short-read and long-read datasets. PanGaea achieves across workloads, outperforming CPU/GPU baselines by 2-3 orders of magnitude and prior accelerators by . Moreover, performance remains robust across error rate regimes to , demonstrating that cross-stage fusion effectively amortizes memory bottlenecks regardless of alignment complexity, and the unified PE design reduces the context-switching overhead between chaining and alignment modes. Mapping accuracy remains intact: F1 scores (not shown) match Minigraph exactly across all evaluated configurations (100, bp-10,Kbp), but we envision negligible loss at longer reads due to bounded-depth path search in the GPF engine, which we leave to future work.
5.3 Power and Area Analysis
Figures 8 and 9 evaluate energy and area efficiency across representative workloads. PanGaea achieves energy efficiency, outperforming JSsCC'25 by and prior accelerators by 2-3 orders of magnitude. The energy gains directly stem from reduced DRAM traffic through cross-stage fusion: eliminating intermediate writebacks (Section 2) reduces off-chip memory access energy, which dominates total power in memory-bound bioinformatics accelerators. For area efficiency, PanGaea delivers demonstrating improvement over JSsCC'25 and 2-3 orders over earlier designs. This area advantage arises from resource sharing and ILP-optimized GLB usage: Mode 2A and Mode 2B share arithmetic units ( area savings), while allreduce-based reduction via PE mesh eliminates dedicated reduction trees used in prior works. Both metrics remain consistent across diverse error rates and read lengths, validating architectural robustness of PanGaea.
Figure 7: Throughput comparison: PanGaea vs. CPU/GPU and other accelerators
Figure 8: Energy Efficiency comparison: PanGaea vs. CPU/GPU and other accelerators
Figure 9: Area Efficiency comparison: PanGaea vs. CPU/GPU and other accelerators
Table 1: Area and Power Breakdown of PanGaea
Component Configuration Area (mm²) Power (mW)
PE Array: Arithmetic Logic 12×12×(ADD+COMP+MAX) 1.6350
Mode Switch MUX 144×(8 MUX×32b) 0.495
GLB: Anchor Bank 185 KB SRAM 0.690
Graph Topo Bank 220 KB (seg+arc lists) 0.7105
Sequence Bank 78 KB (2-bit packed DNA) 0.2540
IR Bank 165 KB (f[1],p[1],v[1] arrays) 0.5585
Local Scratchpad: WTA Matrix Store 315 KB (H/E1/E2/F1/F2) 1.085
GPF Engine: Priority Queue Logic Heap ctr1 + comparators 0.1540
Distance Table 16 KB SRAM 0.0510
Arc Cache 8 KB vertex cache 0.036
GPF Control FSM Path search controller 0.1719
Control & Misc: Main Controller Pipeline orchestration 0.0612
Traceback Engine CIGAR generation 0.038
NoC Crossbar 6×4 master-slave ports 0.015
Total 5.6950
5.4 Area and power breakdown
Table 1 presents the detailed area and power breakdown of PanGaea accelerator. The tri-mode PE array dominates computation, consuming and through diverse dataflows that time-multiplex sparse chaining and dense alignment operations. The hierarchical memory system partitions 648 KB global buffer into four ILP-optimized banks, while 315 KB local scratchpad stores WFA matrices to minimize access latency. The GPF engine accelerates shortest-path computation via priority queue-based search with dedicated distance table storage. Overall, PanGaea achieves total area and power consumption, demonstrating significant improvements in both area and energy efficiency compared to prior accelerators through unified architecture and intermediate reuse.
6 Conclusion
In this paper, we posit that sequence-to-graph (S2G) pipeline should be optimized as a whole, rather than in isolation, to effectively exploit intermediate data reuse across stages. Specifically, we propose PanGaea, a novel accelerator that reformulates the S2G pipeline as a loop fusion problem, reducing intermediate data exchange between memory-intensive stages and thereby optimizing DRAM access. Specifically, we repurpose tiling and fusion techniques to unify the linear chaining, graph chaining, and wavefront alignment stages. In addition, we design a new accelerator architecture capable of dynamically supporting the computation patterns of different pipeline stages. Compared to state-of-the-art ASIC designs, PanGaea delivers on average higher throughput, better energy efficiency and greater area efficiency.
References
[1] Wen-Wei Liao et al. A draft human pangenome reference. Nature, 617:312-324, 2023.
[2] Brice Letcher et al. Gramtools enables multiscale variation analysis with genome graphs. Genome biology, 22(1):259, 2021.
[3] Ting Wang et al. The human pangenome project: a global resource to map genomic diversity. Nature, 604(7906):437-446, 2022.
[4] Yingbo Cui et al. A survey of sequence-to-graph mapping algorithms in the pangenome era. Genome Biology, 26(1):138, 2025.
[5] Yufeng Gu, Arun Subramaniyan, Tim Dunn, Alireza Khadem, Kuan-Yu Chen, Somnath Paul, Md Vasimuddin, Sanchit Misra, David Blaauw, Satish Narayanasamy, et al. Gendp: A framework of dynamic programming acceleration for genome sequencing analysis. In Proceedings of the 50th Annual International Symposium on Computer Architecture (ISCA), pages 1-15, 2023.
[6] Sumit Walia, Cheng Ye, Arkid Bera, Dhruvi Lodhava, and Yatish Turakhia. Talc: tiling genome sequence alignment using convergence of traceback pointers. In Proceedings of 2024 IEEE International Symposium on High-Performance Computer Architecture (HPCA), pages 91-107. IEEE, 2024.
[7] Yichi Zhang, Dibe Chen, Gang Zeng, Jianfeng Zhu, Zhaoshi Li, Longlong Chen, Shaojun Wei, and Leibo Liu. Harp: Leveraging quasi-sequential characteristics to accelerate sequence-to-graph mapping of long reads. In Proceedings of the 29th ACM International Conference on Architectural Support for Programming Languages and Operating Systems, Volume 3 (ASPLOS), pages 512-527, 2024.
[8] Damla Senol Cali et al. SeGraM: A universal hardware accelerator for genomic sequence-to-graph and sequence-to-sequence mapping. In Proceedings of the 49th Annual International Symposium on Computer Architecture, pages 638-655, 2022.
[9] Advait Madhavan et al. Race logic: A hardware acceleration for dynamic programming algorithms. ACM SIGARCH Computer Architecture News, 42(3):517-528, 2014.
[10] Erik Garrison et al. Variation graph toolkit improves read mapping by representing genetic variation in the reference. Nature biotechnology, 36(9):875-879, 2018.
[11] Benedict Paten et al. Genome graphs and the evolution of genome inference. Genome research, 27(5):665-676, 2017.
[12] 1000 Genomes Project Consortium. A global reference for human genetic variation. Nature, 526(7571):68, 2015.
[13] Heng Li. Minimap2: pairwise alignment for nucleotide sequences. Bioinformatics, 34(18):3094-3100, 2018.
[14] Heng Li et al. The design and construction of reference pangenome graphs with minigraph. Genome biology, 21(1):265, 2020.
[15] Heng Li. Minimap and minimap: fast mapping and de novo assembly for noisy long sequences. Bioinformatics, 32(14):2103-2110, 2016.
[16] Mohamed Ibrahim Abouelhoda et al. Replacing suffix trees with enhanced suffix arrays. Journal of discrete algorithms, 2(1):53-86, 2004.
[17] Santiago Marco-Sola et al. Fast gap-affine pairwise alignment using the wavefront algorithm. Bioinformatics, 37(4):456-463, 2021.
[18] Mikko Rautiainen and Tobias Marschall. Graphaligner: rapid and versatile sequence-to-graph alignment. Genome Biology, 21(1):1-28, 2020.
[19] Jouni Sirén, Jean Monlong, Xian Chang, Adam M Novak, Jordan M Eizenga, Charles Markello, Jonas A Sibbesen, Glenn Hickey, Pi-Chuan Chang, Andrew Carroll, et al. Pangenomics enables genotyping of known structural variants in 5202 diverse genomes. Science, 374(6574):abg8871, 2021.
[20] Homo sapiens genome assembly GRCh38.p14 - ncb.nlm.nih.gov. https://www.ncbi.nlm.nih.gov/datasets/genome/GCF_000001405.40/. [Accessed 18-11-2025].
[21] 1000 Genomes Project Consortium. A global reference for human genetic variation. Nature, 526(7571):68-74, 2015.
[22] Simon Heumos, Andrea Guarracino, Allison Karlinsky Haug-Baltzell, Piotr Prins, and Erik Garrison. Pangenome graph layout by path-guided stochastic gradient descent. Bioinformatics, 40(1):btaa577, 2024.
[23] Chirag Jain, Haowen Zhang, Yu Gao, and Srinivas Aluru. Co-linear chaining on pangenome graphs. Algorithms for Molecular Biology, 19(1):12, 2024.
[24] George Karypis and Vipin Kumar. METIS: A software package for partitioning unstructured graphs, partitioning meshes, and computing fill-reducing orderings of sparse matrices. University of Minnesota, Department of Computer Science, 1998.
[25] Edsger W Dijkstra. A note on two problems in connexion with graphs. In Edsger Wybe Dijkstra: his life, work, and legacy, pages 287-290, 2022.
[26] Mo Chen, Rezaul Alam Chowdhury, Vijaya Ramachandran, David Lan Roche, and Lingling Tong. Priority queues and Dijkstra's algorithm. 2007.
[27] Eby G Friedman. Clock distribution networks in synchronous digital integrated circuits. Proceedings of the IEEE, 89(5):665-692, 2002.
[28] Shilin Tian, Chase Szafranski, Ce Zheng, Fan Yao, Ahmed Louri, Chen Chen, and Hao Zheng. Vita: Vi acceleration for efficient 3d human mesh recovery via hardware-algorithm co-design. In Proceedings of the 61st ACM/IEEE Design Automation Conference (DAC), pages 1-6, 2024.
[29] Yichi Zhang, Jianfeng Zhu, Liangwei Li, Gang Zeng, Dibe Chen, Tairan Zhang, Yeyang Deng, Zhicheng Gong, Aoyang Zhang, Yang Liu, et al. A 28-nm 239-bp/μ) agile pangenome analysis accelerator for multi-scheme read mapping. IEEE Journal of Solid-State Circuits, 2025.
[30] Yoongu Kim, Weikun Yang, and Onur Mutlu. Ramulator: A fast and extensible dram simulator. IEEE Computer Architecture Letters, 15(1):45-49, 2015.
[31] IC Compiler II: Place & Route Solution | Synopsys - synopsys.com. https://www.synopsys.com/implementation-and-signoff/physical-implementation/ic-compiler.html.
[32] Valerie A Schneider et al. The GRCh38 reference genome assembly. Genome Research, 2017.
[33] Weichun Huang, Leping Li, Jason R Myers, and Gabor T Marth. ART: a next-generation sequencing read simulator. Bioinformatics, 28(4):593-594, 2012.
[34] GEO Accession viewer - ncb.nlm.nih.gov. https://www.ncbi.nlm.nih.gov/geo/query/acc.cgi?acc=GSM1182889.
[35] Yukiteru Ono, Michiaki Hamada, and Kiyoshi Asai. PBSIM3: a simulator for all types of PacBio and ONT long reads. NAR Genomics and Bioinformatics, 4(3), 2022.
[36] Yukiteru Ono, Kiyoshi Asai, and Michiaki Hamada. Pbsim2: a simulator for long-read sequencers with a novel generative model of quality scores. Bioinformatics, 37(5):589-595, 2021.
[37] Anthony Rhoads and Kin Fai Au. Pacbio sequencing and its applications. Genomics, proteomics & bioinformatics, 13(5):278-289, 2015.
[38] Sergey Nurk et al. The complete sequence of a human genome. Science, 376(6588):44-53, 2022.
[39] Heng Li, Xiaowen Feng, and Chong Chu. The design and construction of reference pangenome graphs with minigraph. Genome Biology, 21(1):1-19, 2020.
[40] Zonghao Feng and Qiong Luo. Accelerating sequence-to-graph alignment on heterogeneous processors. In Proceedings of the 50th international conference on parallel processing, pages 1-10, 2021.
[41] Yatish Turakhia, Gill Bejerano, and William J Dally. Darwin: A genomics coprocessor provides up to 15,000 x acceleration on long read assembly. ACM SIGPLAN Notices, 53(2):199-213, 2018.